
Recently I’ve been looking for an excuse to try out Thomas Lin Pedersen’s new grammar of animation, which is an extension of ggplot2 and a retooling of the existing gganmiate package. You can find the new package here.
Luckily for me, Rafael Irizarry provided the perfect inspiration:
So in honor of Star Wars day, I decided to create Rafael’s TIE fighter GIF using the new gganimate. Before we start, we need to install gganimate from GitHub, and load the packages we’ll need.
# devtools::install_github("thomasp85/gganimate")
library(tidyverse)
library(gganimate)
Create data to plot
We first need to create a data set. We’ll start by defining the number of locations we want our TIE fighter to float between. Here, I’ve set this to be 20 locations. Next, we create the data frame. We set an id for each location, set a random x and y coordinate for each, and then make the label be the shape of the TIE fighter (I’ve also set a random seed so we can exactly replicated these locations later).
set.seed(20180504)

locations <- 20

tie_data <- data_frame(
  id = seq_len(locations),
  x = runif(locations),
  y = runif(locations),
  label = "|-o-|"
)

tie_data
#> # A tibble: 20 × 4
#>       id      x      y label
#>    <int>  <dbl>  <dbl> <chr>
#>  1     1 0.178  0.118  |-o-|
#>  2     2 0.879  0.263  |-o-|
#>  3     3 0.727  0.0742 |-o-|
#>  4     4 0.0797 0.233  |-o-|
#>  5     5 0.727  0.0179 |-o-|
#>  6     6 0.623  0.495  |-o-|
#>  7     7 0.943  0.0155 |-o-|
#>  8     8 0.513  0.931  |-o-|
#>  9     9 0.731  0.933  |-o-|
#> 10    10 0.915  0.980  |-o-|
#> 11    11 0.628  0.330  |-o-|
#> 12    12 0.326  0.843  |-o-|
#> 13    13 0.158  0.833  |-o-|
#> 14    14 0.332  0.181  |-o-|
#> 15    15 0.576  0.439  |-o-|
#> 16    16 0.795  0.252  |-o-|
#> 17    17 0.505  0.718  |-o-|
#> 18    18 0.179  0.625  |-o-|
#> 19    19 0.895  0.698  |-o-|
#> 20    20 0.721  0.968  |-o-|
Create a static plot
Now that we have our data, we can the plot out all of the locations at once to see where our TIE fighter will be flying to. To make it more space like, we can make the plot background black using theme, and make our TIE fighters white and bold. Finally, our TIE fighters will be centered on the x and y coordinates we generated by default. This means that when the coordinates are close to the edge, we risk the wings getting cut off by the plot borders. One solution would be to set the horizontal and vertical alignment based on the coordinates. However, an easier solution is just to expand the limits of the plot using expand_limits, to make sure there is enough padding all the way around.
ggplot(tie_data, aes(x = x, y = y, label = label)) +
  geom_text(color = "white", fontface = "bold", size = 12) +
  expand_limits(x = c(-0.1, 1.1), y = c(-0.1, 1.1)) +
  theme_void() +
  theme(panel.background = element_rect(fill = "black"))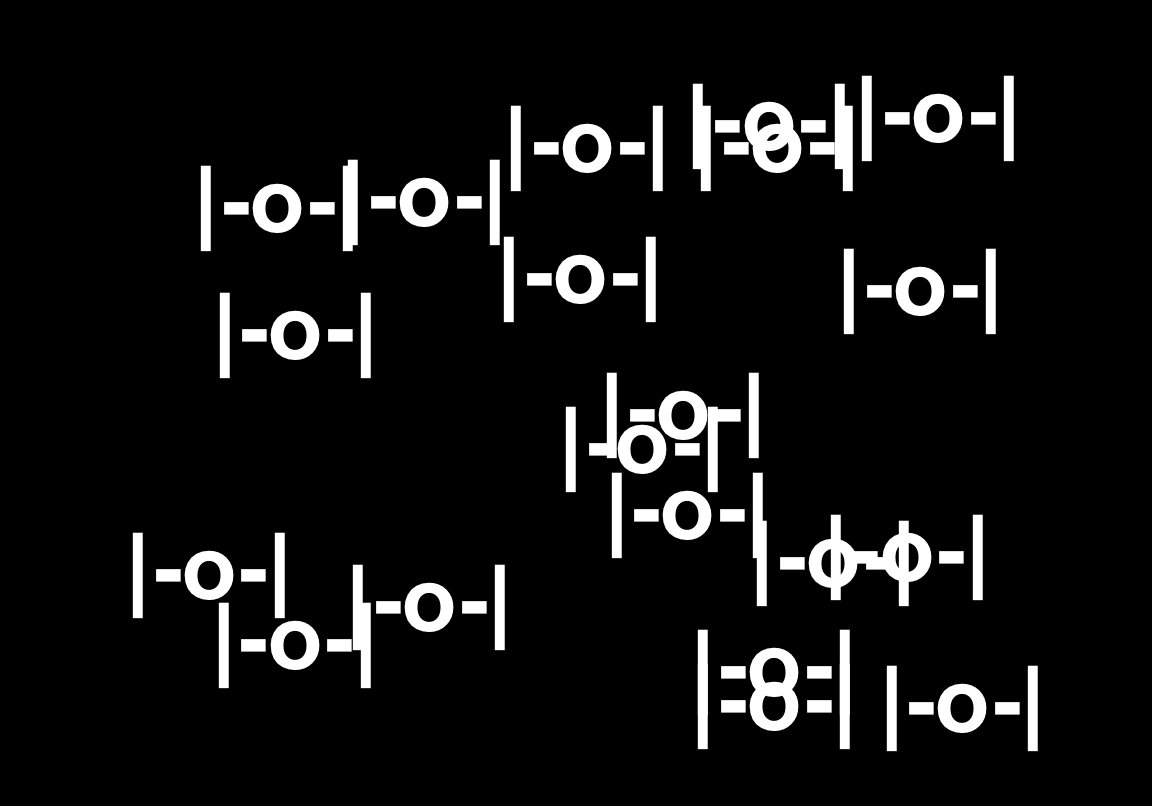
Create an animated plot
Finally, we can animate the plot using gganmiate with just one additional line of code! We simply add a transition_states call, and specify that each id is its own state. We can also specify the relative length of the states and the transitions between them.
ggplot(tie_data, aes(x = x, y = y, label = label)) +
  geom_text(color = "white", fontface = "bold", size = 12) +
  expand_limits(x = c(-0.1, 1.1), y = c(-0.1, 1.1)) +
  theme_void() +
  theme(panel.background = element_rect(fill = "black")) +
  transition_states(id, transition_length = 4, state_length = 1)
And that’s it! Just like that we have an animated TIE fighter using ggplot2 and gganimate! Happy Star Wars day!
Acknowledgments
Featured photo by Tommy van Kessel on Unsplash.